Unemployment Rates
The unemployment rate is a great market indicator for the future market. As long as employment numbers are strong, mortgages will be paid and manufactured items will be purchased.
National Unemployment Rate
2023 2024
Adam's Insight: The August unemployment rate dropped, and I would have never guessed it. The economy felt weaker, the news looked gloomy, but facts felt different from the Social Media. We will see what continues, but my gut tells me that the unemployment rates will continue to grow and this was a fluke.
Florida Unemployment Rate
2023 2024
September 2.8%
October 2.8%
November 2.9%
December 3.0%
Adam's Insight: Florida has held our unemployment rate steady for the last 5 months. Governor Ron DeSantis has managed to keep Florida's economy strong through an interesting election year. It is easier to find electricians and home inspectors are flexible in their times.
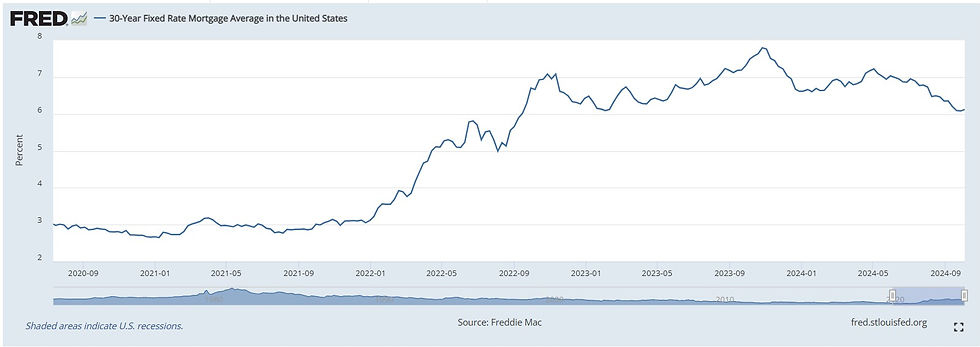
30 Year Mortgage Rate Average in United States
*This information is pulled from the Federal Reserve and Freddie Mac. These are averages for information purposes only. This information is for the first day of the month; remember that a lot can change in 30 days.
2023 2024
September 7.18%
October 7.31%
November 7.76%
December 7.03%
Adam's Insight: Interest rates continue to slide down, slowly but surely. The economy is feeling the pinch and the #FED must do something to create a soft landing.
Spot Gold Price (Price per Ounce)

2023 2024
Spot Silver Price

2023 2024
Brevard County Property Sales Statistics
Brevard County Properties Sold
2023 2024
January 738 686
February 967 893
March 1,262 1,109
April 1,167 1,147
May 1,230 1,246
June 1,188 1,049
July 986 1,158
August 1,108 1,058
September 1,007
October 914
November 908
December 814
Adam's Insight: The number of homes sold is fewer than last month and last year. This sales will continue to slow unless the economy or interest rates greatly change.
Brevard County New Listings

2023 2024
January 1,362 1,578
February 1,210 1,559
March 1,535 1,804
April 1,355 1,781
May 1,489 1,734
June 1,309 1,565
July 1,353 1,424
August 1,476 1,478
September 1,397
October 1,389
November 1,226
December 1,026
Brevard County Active Listings

2023 2024
January 2,672 3,553
February 2,538 3,862
March 2,354 4,037
April 2,332 4,295
May 2,317 4,417
June 2,367 4,496
July 2,469 4,481
August 2,537 4,454
September 2,826
October 3,055
November 3,285
December 3,248
Brevard County Absorption Rate

2023 2024
January 2.35 3.42
February 2.27 3.73
March 2.13 3.92
April 2.13 4.22
May 2.14 4.34
June 2.19 4.40
July 2.31 4.44
August 2.39 4.36
September 2.67
October 2.9
November 3.15
December 3.09
Brevard County Average Sales Price

2023 2024
January $394,815 $414,497
February $394,504 $413,611
March $394,311 $391,721
April $425,760 $457,901
May $420,068 $437,357
June $416,083 $424,678
July $418,235 $426,377
August $435,410 $425,816
September $408,702
October $409,171
November $426,062
December $400,425
Brevard County Average Days on Market

2023 2024
January 26 58
February 31 59
March 22 82
April 68 76
May 18 84
June 62 71
July 15 64
August 65 69
September 19
October 22
November 23
December 29
Written by Broker Adam Maxfield
Real Estate Sales and Investing
Maxfield Home Solutions
(321) 635-0060


Comments